As HTTP/3 and QUIC become standard, legacy monitoring tools often fail to provide visibility into UDP-based traffic. Open-sourcing these capabilities into Prometheus BBE enables engineers to monitor modern network protocols without relying on fragmented or proprietary solutions.
Currently, Slack utilizes a hybrid approach to network measurement, incorporating both internal (such as traffic between AWS Availability Zones) and external (monitoring traffic from the public internet into Slack’s infrastructure) solutions. These tools comprise a combination of commercial SaaS offerings and custom-built network testing solutions developed by our internal teams over time. This was a suitable enough solution for our needs.
When we began rolling out HTTP/3 support on the edge, there was a significant challenge that we encountered: A lack of client-side observability.
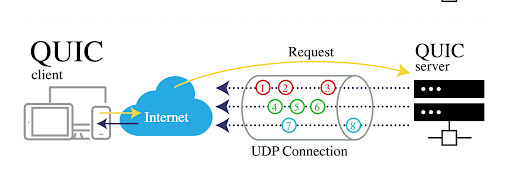
Since HTTP/3 is built on top of the QUIC transport protocol, it uses UDP instead of the traditional TCP. This fundamental shift to a new transport meant that existing monitoring tools and SaaS solutions were not capable of probing our new HTTP/3 endpoints for metrics.
At that time, there was a major gap in the market:
Without the ability to probe hundreds of thousands of HTTP/3 endpoints in our new infrastructure, we couldn’t get the client-side visibility we needed to monitor regressions to HTTP/2 or accurate round trip measurements.
The Open Source Contribution
Our intern, Sebastian Feliciano, scoped, implemented, and ultimately open-sourced QUIC support for Prometheus BBE
Choosing the Right HTTP Client: The first step was selecting a QUIC-capable HTTP client. After careful consideration, they chose quic-go to serve as the foundation for the new functionality. The choice was settled on due to its wide adoption across other open source technologies, as well as the first-class support it provides in creating http clients in go.
Here’s how Sebastian integrated quic-go into BBE’s HTTP client:
http3Transport := &http3.Transport{
    TLSClientConfig: tlsConfig,
    QUICConfig:      &quic.Config{},
}

client = &http.Client{
    Transport: http3Transport,
}
Maintaining Composability: Sebastian had to add this new logic while following the Blackbox Exporter’s existing architecture, ensuring the new features maintained the tool’s configuration patterns.
The result of this work was a functional and configurable HTTP/3 probe within Prometheus, and by open-sourcing their contribution, they provided a solution that the entire Prometheus community could use. By following existing patterns and earning community buy-in, Sebastian successfully landed the HTTP/3 feature.
Final Step: Integration
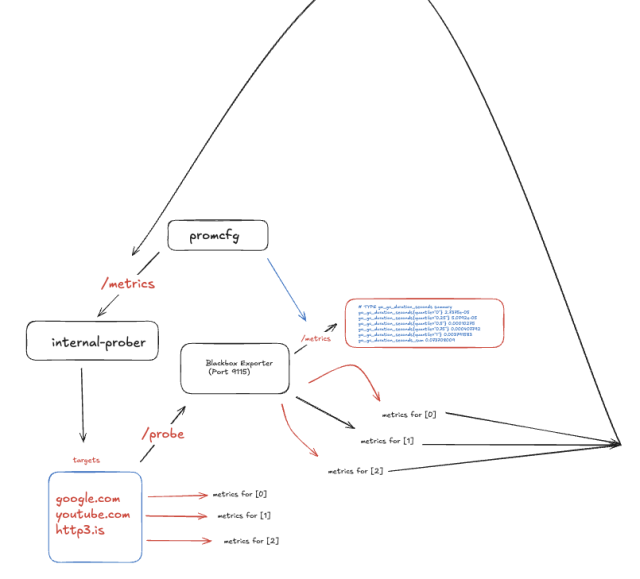
Making an open-source contribution as an intern is a huge accomplishment. As many of us know, maintainers don’t always merge PRs quickly, especially for new features. Sebastian’s internship timeline was limited, so he couldn’t wait. Sebastian took matters into his own hands and architected an in-house system that utilized the new upstream features for probing out HTTP/3 endpoints.
Single Pane of Glass: We now have a unified view of both HTTP/1.1, HTTP/2, and HTTP/3 metrics in Grafana, allowing for easier correlation with other telemetry and comparison.
Better and More Reliable Alerts: With the new probes, we can create more reliable alerts on the health and performance of our HTTP/3 endpoints.
Easier Correlation: Having all our data in one place makes it easier to correlate HTTP/3 performance with other metrics and debug issues faster.
Community Benefit: This contribution benefits the wider Prometheus community, helping other organizations facing the same challenges with HTTP/3 adoption. By building this support, we have future-proofed our observability for the ongoing adoption of QUIC and HTTP/3.
While this is a major step, our work isn’t done. Future improvements could be made through adding advanced features, such as:
We invite others in the community to try out this new QUIC support in Prometheus Blackbox Exporter and join us in building the next generation of observability tools. You can find the HTTP/3 configuration in the configuration documentation in the Prometheus Black Box Exporter repository.
There were a few takeaways from this project:
1. Monitor first, and migrate second
This should go without saying, but getting observability right as a precursor to migration makes everything faster. We know that the industry is going towards QUIC, but proving to ourselves that it’s the right move long term enables us to invest more into its future.
2. Contributing open source pays dividends
It feels good to give back to open source communities who provide us so much. When a game changing protocol like QUIC comes through, and there’s a gap in existing technologies supporting it, everyone wins when we fill the gap, and we win when everyone decides to support it long term.
3. Bet on your interns
We were incredibly fortunate to have landed Sebastian as an intern for our team. His proactiveness and creativity in problem solving helped us push the QUIC migration across the line, and gave us tangible exposure to the benefits of black-box monitoring.
This journey from having an observability gap to an open-sourced solution perfectly illustrates our commitment to simplicity and scalability. As HTTP/3 adoption grows industry-wide, we’re committed to keeping our monitoring tools ahead of the curve. We welcome community feedback and contributions to help evolve these capabilities further.
Interested in taking on interesting projects, making people’s work lives easier, or just building some pretty cool forms? We’re hiring! 
Continue reading on the original blog to support the author
Read full articleThis article demonstrates how applying core software engineering principles like caching and parallelization to build systems can drastically improve developer experience and delivery speed, transforming slow pipelines into agile ones.
This article demonstrates a practical approach to enhancing configuration management safety and reliability in large-scale cloud environments. Engineers can learn how to reduce deployment risks and improve system resilience through environment segmentation and phased rollouts.
This article details Slack's successful Deploy Safety Program, which drastically cut customer impact from deployments. It provides a practical framework for improving reliability, incident response, and development velocity in complex, distributed systems.
This article showcases a successful, automated approach to a common, complex CI/CD migration challenge. It provides valuable insights into leveraging existing tools and AI to reduce manual effort and accelerate infrastructure shifts, directly impacting developer productivity and system reliability.