Traditional forecasting fails during unprecedented shocks. This approach demonstrates how to maintain model accuracy in data-scarce environments by using Bayesian prior propagation and cross-geographic signals, providing a blueprint for handling asynchronous global disruptions.
How Airbnb used sequential geographic recovery signals and prior propagation to generate reliable corridor-level forecasts when local data was scarce.

By: Harrison Katz
Almost every forecasting system is built on the same implicit assumption: the future will resemble the past. You train on historical data, you validate on holdout periods, and you trust that past patterns will at least roughly indicate future performance. When this assumption breaks, the model does not gracefully degrade; it fails confidently. It produces precise, well-calibrated intervals around the wrong answer.
The acute phase of COVID, from early to late 2020, was a clear illustration of this, and we wrote about it in a previous post. But the more interesting forecasting problem was not the shutdown. It was everything that came after.
The period from late 2020 through 2022 was not a single coherent regime. It was a sequence of overlapping, asynchronous changes: vaccine rollouts that reached some markets months before others, border reopenings that followed their own country-level timelines, reclosures triggered by new variants that hit different corridors (a pairing of the traveler’s origin city and destination city) at different moments.
Demand was not recovering uniformly. It was rebounding unevenly across every corner of the world, in ways that had no historical precedent and no single governing pattern.
The standard response to a shock is to wait for each affected market to accumulate its own post-shock data and retrain locally. But Covid was among the biggest shocks the travel industry has faced in decades. With markets worldwide reopening and reclosing on staggered schedules, waiting for markets to settle meant forecasting blind for months at a time, across all markets, just when timely projections were most needed, in the circumstances.
So we started building something different. When we could not simply look backward in time for relevant examples, we looked sideways across geographies instead.
The key observation was that the recovery was not happening everywhere at once. It was unfolding sequentially, and messily, often punctuated by further reclosings and reopenings. Vaccines reached some markets in early 2021 and others months, a few quarters, or many quarters later. Some borders reopened in spring and reclosed by autumn. Demand in one corridor could be surging while an adjacent corridor was still effectively shut.
This sequential, asynchronous structure was operationally painful. But it contained more information than might have been obvious on initial consideration.
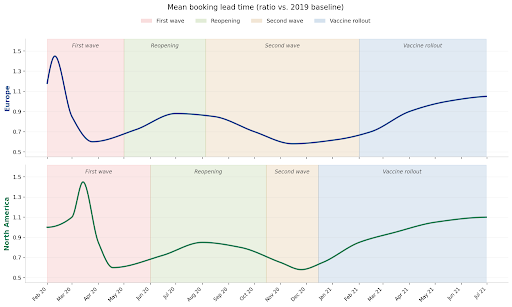
One of the clearest signals we track is the mean lead time for bookings: how far in advance guests book relative to their travel dates, measured as a ratio against the same period in a baseline set in 2019, the last fully pre-pandemic year. When there is a disruption, and the pandemic as a whole was the largest disruption we’ve ever seen, lead times compress sharply as travelers shorten planning horizons for the trips they do take, then lengthen again as conditions stabilize.
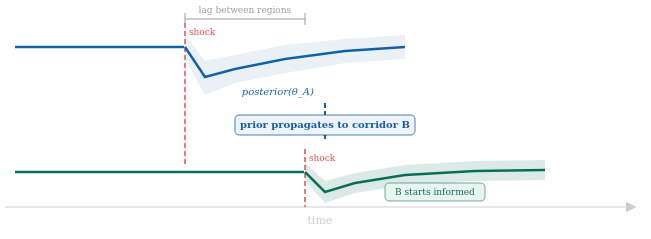
The figure below shows this signal for Europe and North America across the major phases of the pandemic. The key observation is not the shape of either curve in isolation. It is the lag between them.
Europe’s first wave of booking lead time compression hit in February 2020. North America’s came roughly four to six weeks later, but following the same trajectory. The reopening recovery was partial in both regions, because the travelers who returned first were booking short-lead-time trips rather than resuming normal planning horizons. And when vaccine rollout arrived, the direction reversed: North America turned the corner in December 2020, while Europe was still in its second wave trough, and did not begin its recovery until February and March 2021.
Once we could see how demand responded to reopening in one of the two markets, we had a genuine signal about how demand was likely to respond when the other market reopened later. It was not a perfect signal. The markets were distinct, the timing varied, and the traveler mix was somewhat different. But the underlying dynamics were related.
Travelers responded to reopened borders, to restored flight routes, and to lifted entry requirements, in ways that were not completely idiosyncratic to each corridor. Corridors in the earlier-reopening market were ahead of the later-reopening market in time, but they were observing the same underlying phenomena.
In Bayesian terms, the structure is as follows. A brief glossary: c is a corridor; θ_c denotes the demand parameters for corridor c; φ denotes hyperparameters shared across all corridors; and w(c, c’) denotes the similarity weight between corridors. Each corridor has demand dynamics governed by corridor-level parameters θ_c, drawn from a shared population distribution:
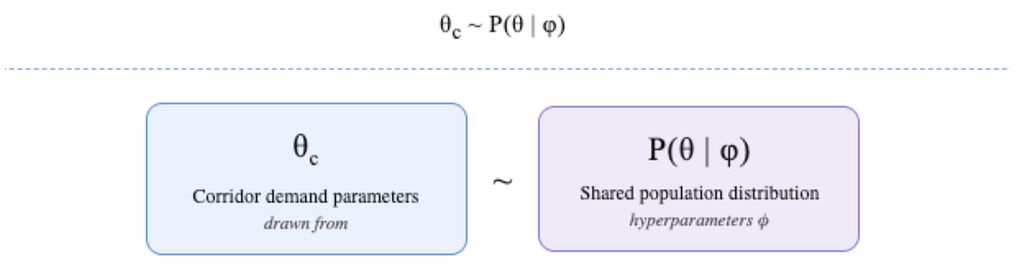
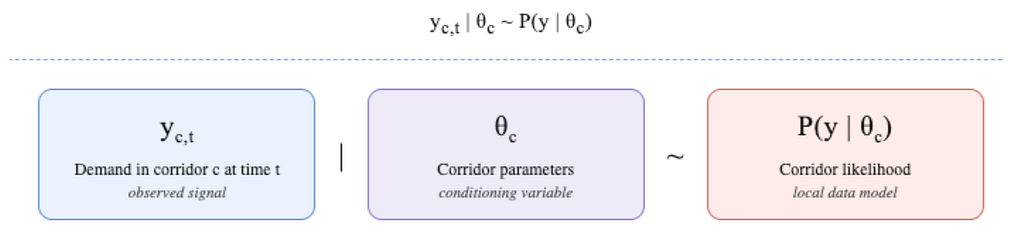
where φ are hyperparameters estimated jointly across all corridors and y_{c,t} is the observed demand signal in corridor c at time t. This is a standard hierarchical setup.
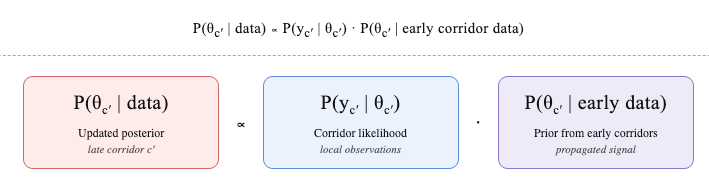
The innovation is what happens when a change hits corridor c at time τ_c, and a similar corridor c’ experiences the same change later at τ_{c’} > τ_c. Rather than waiting for local data in c’ to accumulate, the posterior from the early-affected corridor (the updated belief about its parameters after observing local data) becomes an informative prior for the late-affected one:
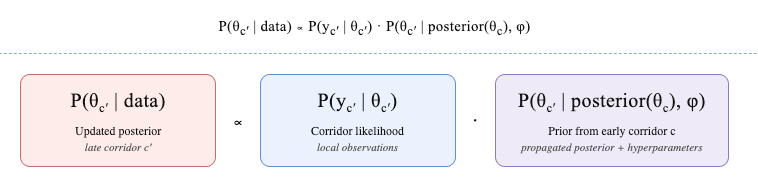
You are not extrapolating from the past. You are propagating observable evidence from one part of the world to another, in real time.
We did not design this system in advance. We built it as events unfolded.
By mid-2020 it was becoming clear that the recovery was not going to be a single global event. Areas were going to open and close on their own timelines, and our models, which had been designed for a world with a stable shared regime, were not equipped for a world where each corridor was effectively in a different phase of the same phenomenon at any given moment.
The first version wasn’t perfect, but it gave us something concrete to build on. We started by identifying corridors where meaningful demand data had returned, where borders had reopened enough to observe actual traveler behavior, and using those as reference points for similar corridors that were still closed or just beginning to reopen. The process was manual, and heavily dependent on human judgment, at the start.
Over time we formalized the process. Airbnb operates across a wide range of origin-destination corridors globally, and that breadth is what made the approach tractable at scale.
The core idea was simple: not all corridors are equally informative about one another. A market with similar traveler composition, similar reliance on international versus domestic demand, and similar accommodation mix should receive a stronger prior from an early-recovering corridor than one that differs substantially on those dimensions. We weighted the information transfer accordingly, so the signal flowed most strongly between corridors that were genuinely structurally similar.
The system earned its keep across all of it: the initial reopenings, the reclosures triggered by new variants, and the uneven rollout of vaccines across regions. In each phase, some corridors were ahead of others, and the ones ahead had something useful to say about the ones that were not yet there. The information was never perfect, but it was available immediately, rather than weeks or months later; that timeliness was often the entire point.
The result was that we could generate informative forecasts across the corridor network throughout the recovery period, including in markets where local data was thin, at precisely the moments when Finance needed the most reliable read on where demand was heading.
This approach is not universally available. It requires a specific data structure that Airbnb happens to have.
First, you need enough geographic breadth and granularity for the information sharing to be meaningful. The approach works because some markets are ahead of others in time, and because structurally similar markets exist to borrow from. The more corridors you observe, and the more resolution you have within each one, the richer the signal you can propagate. Airbnb’s global footprint across a wide range of origin-destination pairs gave us enough diversity to find genuinely informative analogues for almost any market we needed to forecast.
Second, you need consistent data across those corridors. The measurements you take in one region need to be directly comparable to the priors you set in another. Airbnb’s booking data is collected in a consistent format globally, which means a demand response measured in Europe translates cleanly into a prior for Asia-Pacific, without a translation layer.
Third, you need a modeling framework that can incorporate informative priors at the corridor level and update them as local data arrives. A standard time series model estimated on a single corridor’s history cannot do this. A hierarchical Bayesian framework that treats corridor-level parameters as draws from a shared distribution can: the prior propagation across geographies is a natural extension of the hierarchical structure.
We built this during the pandemic recovery, but the underlying logic applies to any change that rolls out sequentially across geographies or market segments. The change does not have to be a crisis.
Consider how a platform introduces new product features. A new payment plan option, a change to cancellation policy, or a new booking flow does not launch everywhere simultaneously. It typically rolls out to a subset of markets or corridors first.
The early markets are a source of information about what to expect when the feature reaches the next wave. If the first corridors to receive a new payment plan show a measurable shift in booking lead times or cancellation rates, that signal can inform the priors for corridors where the feature has not yet launched. You are not waiting to observe the effect everywhere before you can say anything; you are propagating what you already know into relevant forecasting.
The same logic applies to regulatory changes, which rarely hit all regions simultaneously. Or to commodity price shocks: an energy price spike hits origin markets with high fuel-cost sensitivity before it ripples through to destinations, and the corridors that feel it first carry information about how demand will shift when it arrives elsewhere. Or to any macroeconomic or geopolitical development that affects different origin-destination corridors at different moments, which in travel is most of them.
In each of these cases, the question is the same: is your modeling infrastructure set up to learn from the early-signal markets in real time, and to propagate that learning before the change arrives everywhere else?
At Airbnb, this approach has become a standing part of how we think about forecasting when demand conditions are shifting unevenly across markets. It does not apply to every problem. But when the environment is evolving sequentially, and structurally similar corridors exist to borrow from, waiting for local data is no longer the only option.
Three things stand out from building and operating this system.
Geographic structure is underutilized information. Most forecasting teams treat each market or region as an independent problem. The shared dynamics across geographically and economically similar corridors are a source of signal that is almost entirely ignored in standard approaches, but which are likely to provide actionable information. This matters during any sequentially-rolling change, not just crises.
Sequential rollouts are an underused source of signal. The instinct, when a change hits some markets before others, is to treat the unaffected markets as a separate problem until local data accumulates. The more useful instinct is to identify which markets were affected first and treat them as leading indicators. This reframe shifts you from “we have no data yet” to “we have early evidence from analogous markets.”
Bayesian hierarchical models are a powerful tool for this problem. The prior-propagation mechanism is not a hack or a workaround. It is exactly what hierarchical Bayesian models are designed to do: share information across related units while allowing local data to update the shared prior as it arrives. As observations accumulate in a later-affected corridor, the update follows the standard form:
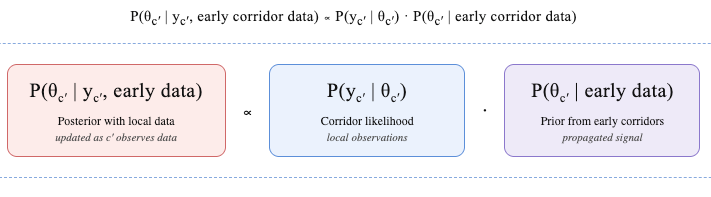
The balance between the propagated prior and the local likelihood shifts automatically as data accumulates. Early on, when c’ has little local data, the prior from similar corridors dominates. As observations arrive, the local likelihood takes over and the corridor estimate converges toward its own experience; no manual tuning required. The information sharing is heaviest when it matters most, and gracefully recedes as it is no longer needed.
In addition to long-lasting disturbances due to Covid, the world has not been short of disruptions since 2020. Many of them have arrived with their own geography, their own timeline, and their own reasons why the historical record was not quite the right guide. When disruptions do unfold sequentially across a heterogeneous corridor network, that is exactly the structure this framework is designed to exploit most effectively. It will not be the right tool every time. But it has been the right tool often enough that we have stopped treating it as a crisis response and started treating it as standing infrastructure.
We did not plan to build this system. We built it because the alternative, waiting for each market to tell its own story on its own schedule, could not keep pace with rapidly evolving conditions. That turns out to be a reasonable description of how most useful forecasting infrastructure gets built.
If this type of work interests you, check out some of our related positions.
Acknowledgments
Thanks to Liz Medina and Jess Needleman for building and improving the forecasting systems described here, and to Carolina Barcenas, Yuanyuan Cui, and Adam Liss for their support of this work and its publication.
Harrison Katz leads Finance Data Science & Strategy at Airbnb. His research focuses on Bayesian methods for compositional and hierarchical time series, Bayesian decision theory, & Forecast governance.
All product names, logos, and brands are property of their respective owners. All company, product, and service names used in this website are for identification purposes only. Use of these names, logos, and brands does not imply endorsement.
When history fails you, borrow from geography was originally published in The Airbnb Tech Blog on Medium, where people are continuing the conversation by highlighting and responding to this story.
Continue reading on the original blog to support the author
Read full articleTraditional testing fails with non-deterministic LLMs. Eval-driven development provides a systematic framework to ensure GenAI reliability, preventing regressions and aligning model outputs with product goals through structured, multi-layered validation.
Airbnb demonstrates how to scale Transformer models for recommendation systems by balancing long-term intent with short-term behavior. Their optimization techniques for training efficiency and decoupled inference provide a blueprint for handling massive, sparse event sequences in production.
LLM evaluation is often slow and non-deterministic, making it hard to trust results. By implementing deterministic caching and diagnostic framing of noise, engineers can iterate on models in hours instead of weeks, ensuring that improvements are meaningful and stable for production.
Traditional forecasting fails when data structures shift. Airbnb's B-DARMA framework provides a robust way to model compositional data and handle structural breaks, ensuring models remain accurate during global shocks and permanent behavioral shifts in consumer data.